Bill Northcutt at Spatial Rainfall Consulting sent me my updated rainfall data for April. It's not as much as Cincinnati reports but it is enough to keep us out of the fields all month and the upcoming days in May.
"I ran your report and said Holy Mackerel! I hadn't paid that much attention to rain in your territory - no planting anytime soon.
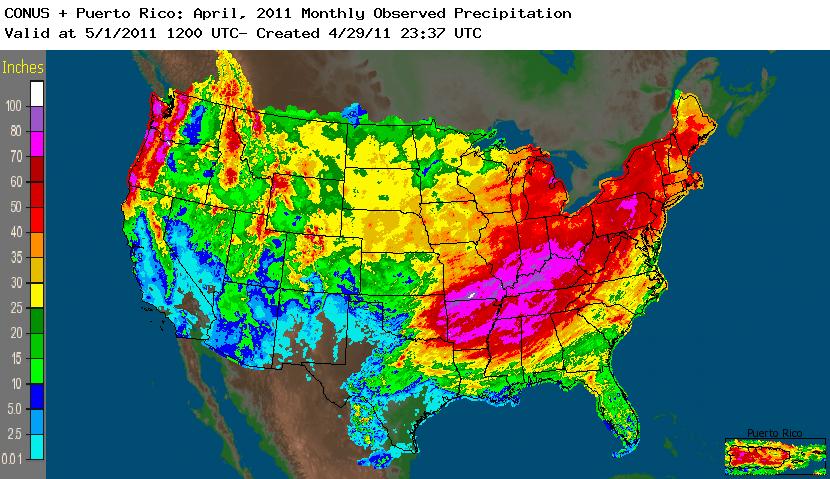
Here is your report and I'm attaching a map from NWS on a visual - I noticed they screwed up on the scale - but your area is in the 8-10" range and some in the 10-15" range and the numbers below support it.
Bill
Date B Farm H Farm New Farm Home Farm L Farm/M Farm
4/1/2011 0 0 0 0 0
4/2/2011 0.12 0.09 0.13 0.28 0.29
4/3/2011 0.02 0.01 0.02 0 0.01
4/4/2011 0 0 0 0 0
4/5/2011 1.34 1.43 1.51 1.63 1.49
4/6/2011 0.01 0 0.01 0 0
4/7/2011 0 0 0 0 0
4/8/2011 0.05 0.07 0.06 0.01 0.01
4/9/2011 0.01 0.01 0.01 0.01 0.01
4/10/2011 0.29 0.35 0.35 0.37 0.4
4/11/2011 0 0 0 0 0
4/12/2011 1.18 1.31 1.23 1.34 1.32
4/13/2011 0.79 0.36 0.38 0.11 0.14
4/14/2011 0 0 0 0 0
4/15/2011 0 0 0 0 0
4/16/2011 0.67 0.48 0.49 0.51 0.51
4/17/2011 0.06 0.04 0.03 0.03 0.04
4/18/2011 0 0 0 0 0
4/19/2011 1.23 0.74 1.52 0.61 0.76
4/20/2011 1.09 1.29 1.96 1.73 1.76
4/21/2011 0.04 0.03 0.03 0.04 0.07
4/22/2011 0 0.02 0 0.01 0.02
4/23/2011 0.82 0.75 1.14 0.93 0.92
4/24/2011 0.69 0.73 0.44 0.49 0.52
4/25/2011 0.33 0.37 0.17 0.31 0.37
4/26/2011 0 0.04 0.04 0.13 0.18
4/27/2011 0.11 0.06 0.11 0.15 0.16
4/28/2011 0.63 0.52 0.56 0.29 0.25
4/29/2011 0.13 0.11 0.16 0.18 0.27
Total 9.66 8.83 10.38 9.19 9.53
Every year is a challange for farmers and this one is no different but different in the amount in one month. We received 1/4 of the year's rainfall in one month!
Ed


